China bought almost two in three electric cars
New electric cars sold in 2024, millions
China accounted for 64.6% of global sales: 11.3 million, compared with 6.2 million in the rest of the world.
Your spreadsheet,
as a chart worth sharing.Make an interactive bar chart from your CSV or Excel file. Choose your fields, make it yours, and download it. Your data stays in this browser.
Updated
CSV, Excel, Parquet or JSON. Drop a file anywhere on this page.
Nothing is uploaded.
Paste rows from a spreadsheet or CSV. Nothing is uploaded.
No upload. No sign-in. Yours to edit.
Preparing a real chart from the example data…
China bought almost two in three electric cars
New electric cars sold in 2024, millions
China accounted for 64.6% of global sales: 11.3 million, compared with 6.2 million in the rest of the world.
Start with a real public dataset, then bring your own file. Every example runs through the xmetric engine.
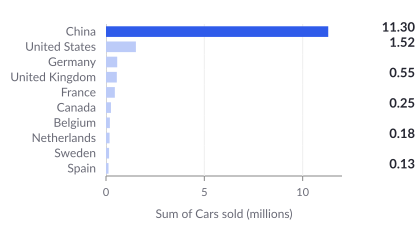
China led this selection in electric car sales
New battery-electric and plug-in hybrid cars sold in 2024, millions; 10 selected countries
China: 11.3 million cars; United States: 1.52 million.
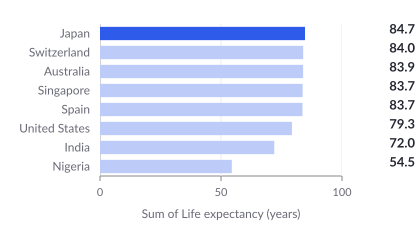
Life expectancy spans 30 years in this selection
Period life expectancy at birth in 2023, years; eight selected countries
Japan: 84.7 years; Nigeria: 54.5 years. Period life expectancy applies that year’s mortality rates throughout life.
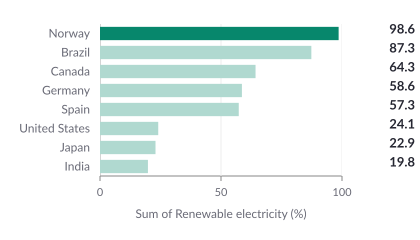
Norway generated almost all its electricity from renewables
Renewable share of electricity generation in 2024; eight selected countries
Norway: 98.6%; Brazil: 87.3%. The denominator is electricity generated, not all energy consumed.
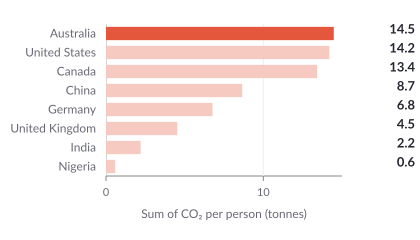
CO₂ emissions per person vary across eight countries
Territorial fossil and industrial CO₂ emissions per person in 2024, tonnes
Australia: 14.5 tonnes per person; India: 2.2 tonnes per person.
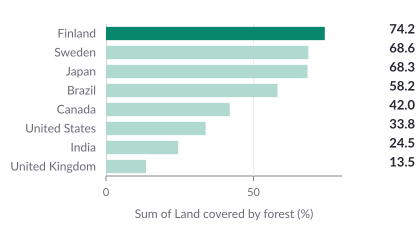
Forest covers nearly three quarters of Finland’s land
Forest share of land area in 2025; eight selected countries
Finland: 74.2%; United Kingdom: 13.5%. Forest includes natural forests and plantations.
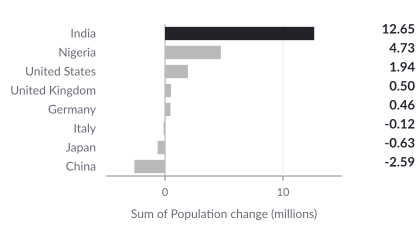
Population rose in some countries and fell in others
Net change in population in 2023, millions; eight selected countries
India: +12.65 million; China: −2.59 million. Net change includes births, deaths and migration.
A bar chart compares aggregated values across categories using bar length.
Definition source: Bar chart reference. xmetric uses its own native chart engine.
China accounted for 64.6% of global sales: 11.3 million, compared with 6.2 million in the rest of the world.
Source: IEA Global EV Outlook · Our World in Data. These are public example rows, not your file.
| Country | EVs sold (millions) |
|---|---|
| China | 11.3 |
| United States | 1.52 |
| Germany | 0.57 |
| United Kingdom | 0.55 |
| France | 0.45 |
| Canada | 0.252 |
| Belgium | 0.197 |
| Netherlands | 0.182 |
| Sweden | 0.157 |
| Spain | 0.128 |
Choose a line graph when the horizontal axis is ordered time rather than separate categories.
| Chart | Use it for |
|---|---|
| Bar chart | A bar chart compares aggregated values across categories using bar length. |
| Line graph | Choose a line graph when the horizontal axis is ordered time rather than separate categories. |
These limits apply to tabular imports, not native Power BI or Tableau report compatibility. File size and browser memory limit what xmetric can open. Group large datasets before drawing a chart.
| Limit | Current behavior |
|---|---|
| File size | 32 MiB on constrained devices; 160 MiB otherwise |
| Imported rows | Up to 3,500,000 |
| Chart marks | Up to 10,000 |
| Download | PNG and SVG; a read-only live embed shares the plotted values |
Source: xmetric limits and verification record, checked 2026-10-27. These are product limits, not file-format limits.
Yes. xmetric reads the selected file or pasted CSV in your browser. Opening and editing this local chart does not upload the file.
Compare totals across categories. Start with Category and Value. Choose the additional series, target or date fields when the controls request them.
Yes. Download PNG or SVG, copy a read-only live embed, or choose Keep editing in xmetric. The embed publishes the plotted categories and values in its link; your original file stays in this browser.