Internet use reached 71% of the world’s population
Share of people who used the internet in the previous three months, world, 2010–2024
The share increased from 28.4% in 2010 to 71.2% in 2024.
Your spreadsheet,
as a chart worth sharing.Make a line graph from CSV or Excel. Choose numeric years or dates and a numeric value. Your data stays in this browser.
Updated
CSV, Excel, Parquet or JSON. Drop a file anywhere on this page.
Nothing is uploaded.
Paste rows from a spreadsheet or CSV. Nothing is uploaded.
No upload. No sign-in. Yours to edit.
Preparing a real chart from the example data…
Internet use reached 71% of the world’s population
Share of people who used the internet in the previous three months, world, 2010–2024
The share increased from 28.4% in 2010 to 71.2% in 2024.
Start with a real public dataset, then bring your own file. Every example runs through the xmetric engine.
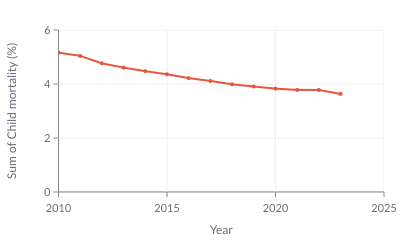
Child mortality fell over the period
Estimated share of newborns dying before age five, world, 2010–2023
The estimated rate fell from 5.16% to 3.63%.
UN, World Population Prospects (2024) – processed by Our World in Data
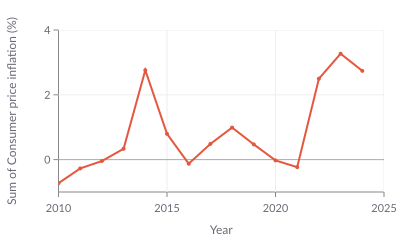
Japan’s consumer price changes crossed zero
Annual consumer price inflation, Japan, 2010–2024
The rate was −0.73% in 2010, −0.23% in 2021 and +3.27% in 2023.
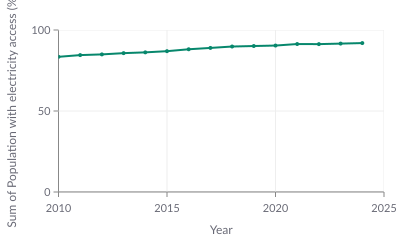
More people had access to electricity
Share of population with access to electricity, world, 2010–2024
The estimated share rose from 83.5% in 2010 to 91.9% in 2024.
Data compiled from multiple sources by the World Bank – with minor processing by Our World in Data
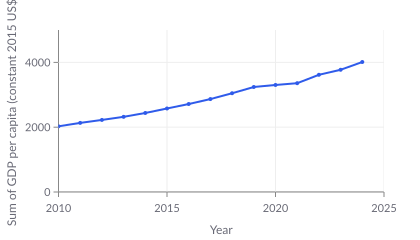
Vietnam’s output per person increased
GDP per capita, Vietnam, constant 2015 US dollars, 2010–2024
Output per person rose from about 2,028 USD in 2010 to 4,013 USD in 2024.
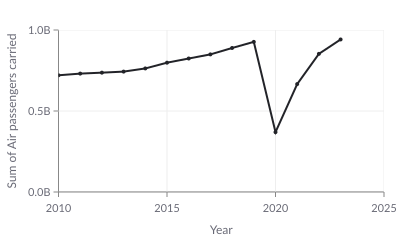
Passenger traffic fell sharply in 2020 and recovered
Passengers carried by US-registered airlines, domestic and international, 2010–2023
The count fell from 926.7 million in 2019 to 369.5 million in 2020, then reached 941.6 million in 2023.
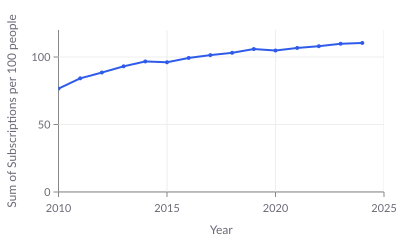
Mobile subscriptions exceeded 100 per 100 people
Mobile cellular voice subscriptions per 100 people, world, 2010–2024
The rate rose from 76.6 per 100 in 2010 to 110.4 in 2024; one person can have multiple subscriptions.
International Telecommunication Union (ITU), via World Bank (2026) – processed by Our World in Data
A line graph connects observations across an ordered axis to show change.
Definition source: Line graph reference. xmetric uses its own native chart engine.
The share increased from 28.4% in 2010 to 71.2% in 2024.
Source: World Telecommunication/ICT Indicators Database - International Telecommunication Union (ITU), via World Bank (2026) – with major processing by Our World in Data. These are public example rows, not your file.
| Year | Internet users (%) |
|---|---|
| 2010 | 28.4 |
| 2011 | 30.9 |
| 2012 | 33.3 |
| 2013 | 35.3 |
| 2014 | 37.4 |
| 2015 | 39.9 |
| 2016 | 43.6 |
| 2017 | 46.3 |
| 2018 | 49.4 |
| 2019 | 53.9 |
| 2020 | 60.1 |
| 2021 | 63.8 |
| 2022 | 67 |
| 2023 | 69.2 |
| 2024 | 71.2 |
Choose bars for separate categories without an ordering that makes connecting them meaningful.
| Chart | Use it for |
|---|---|
| Line graph | A line graph connects observations across an ordered axis to show change. |
| Bar chart | Choose bars for separate categories without an ordering that makes connecting them meaningful. |
These limits apply to tabular imports, not native Power BI or Tableau report compatibility. File size and browser memory limit what xmetric can open. Group large datasets before drawing a chart.
| Limit | Current behavior |
|---|---|
| File size | 32 MiB on constrained devices; 160 MiB otherwise |
| Imported rows | Up to 3,500,000 |
| Chart marks | Up to 10,000 |
| Download | PNG and SVG; a read-only live embed shares the plotted values |
Source: xmetric limits and verification record, checked 2026-10-27. These are product limits, not file-format limits.
Yes. xmetric reads the selected file or pasted CSV in your browser. Opening and editing this local chart does not upload the file.
Follow values across an ordered series. Start with Period and Value. Choose the additional series, target or date fields when the controls request them.
Yes. Download PNG or SVG, copy a read-only live embed, or choose Keep editing in xmetric. The embed publishes the plotted categories and values in its link; your original file stays in this browser.